Preface
This article was written after we noticed many of our clients, even ones with fairly sophisticated understandings of color science, were making custom color profiles using a given target and then evaluating the resulting quality using that same target. This is a big no no, as explained in this article, and can lead to false confidence in the results and lead to decisions that lower color accuracy. Whatever software you use for profiling and validation it’s important to follow the best practice of profiling and validating using different kinds of targets.
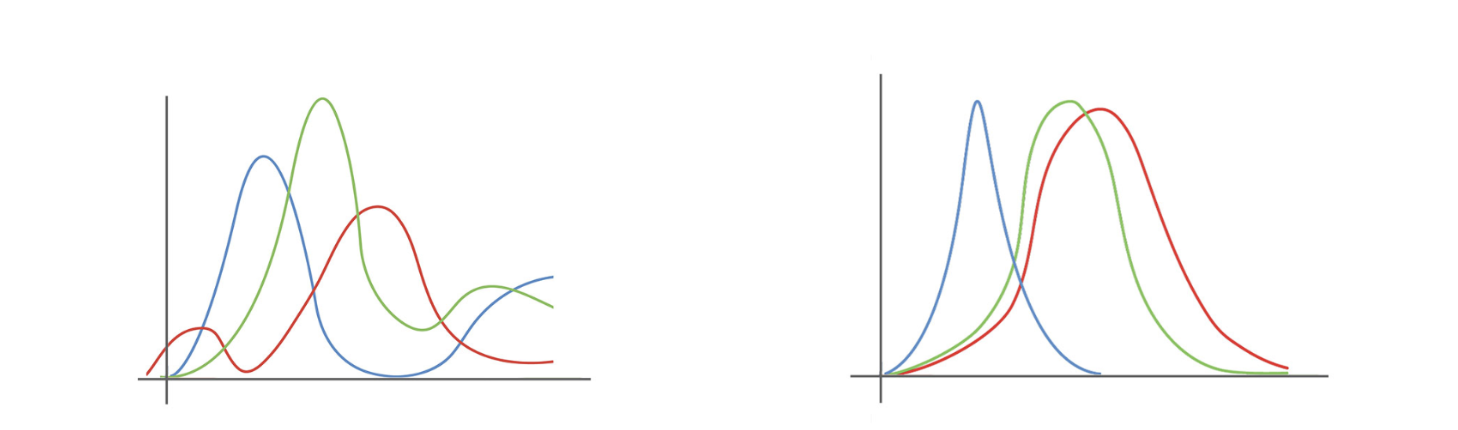
Left: The RGB response curve of a modern RGB camera. Right: The LMS cones of the human eye. They differ significantly, so one must calibrate the camera to emulate the eye.
Introduction – Why we Need Color Profiles
The reason color is hard to get right is that, in a very real sense, it doesn’t exist. At least not as a physical reality.
Color is a human sensation. The eye responds to certain wavelengths of the light and the brain interprets those responses in a way that we experience as color. For a variety of technical reasons the sensor in a camera does not respond to light in a manner that is identical to the eye. Therefore we profile the response of the camera sensor so it can emulate an eye.
This calibration process known as Color Profiling is almost always done by capturing a physical target which has been independently measured with a spectrophotometer. The RGB data from the camera is then profiled using the reference target values from the spectrophotometer.
Types of Profiles
This 6-channel matrix profile from a DT Fusion system holds a total of 18 values for about half a kilobyte of data. A standard LUT profile contains hundreds or thousands of value pairs and are often more than 100 kilobytes. Bigger is not always better; simple color models are less prone to false-positives and overfitting.
There are two mathematical methods that can be used to accomplish that profiling: Matrix and LUT.
- LUT Profiling: The camera’s response to each target patch is taken as an anchor point and the “fabric” of the color response is pulled in three dimensions in order to hit those anchor points.
- Matrix profiling: The patch values are used to create a simple mathematical model of the relationship between the underlying response of the sensor combination and the response of the human eye..
Because matrix profiling works from first principles of how the camera responds to color versus how the eye responds to color, a matrix profile is incredibly simple. A typical RGB camera matrix profile consists of nine values representing the color response contribution of each channel combination.
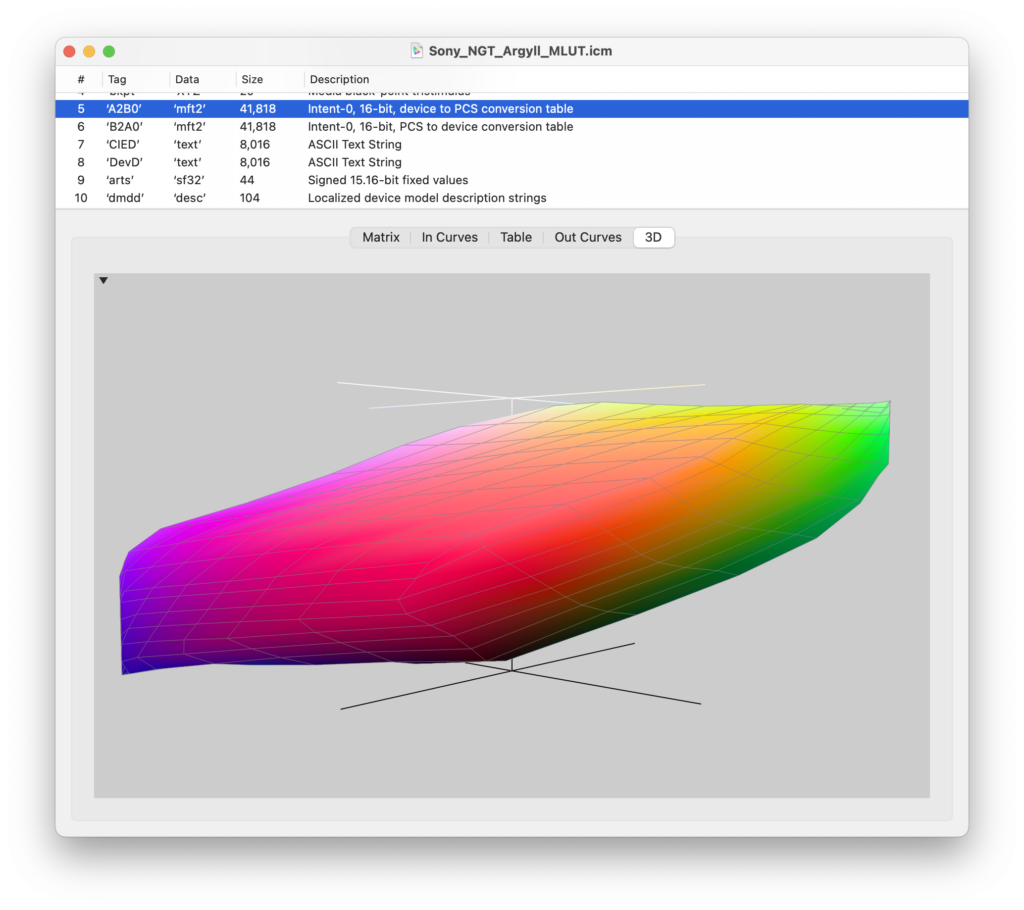
A LUT is often so large that a table of values would be inscrutable. Here is one visualization in 3D space. The warping of the native color response to best fit the trained data occurs in three dimensions and can produce unexpected results at points in between or outside of the training data; that won’t be uncovered by using the same target to evaluate a LUT as was used to make the LUT.
In contrast a LUT profile isn’t really a mathematical adaptation of the camera’s overall color response, so much as it is a set of specific answers – one answer for each patch in the target it was trained on (and in some cases some interpolated answers in between).
Because LUT profiling uses each patch in the color target as an anchor, the resulting profile will surely be extremely accurate for those specific patches and for material that is very similar in nature to those specific color patches. But the real world contains a truly staggering number of colors formed from an even larger number of spectral characteristics, so even if you have a target with a large number of patches, most real world subject matter will fall in between or outside those patches. A 130 patch target sounds like a lot, until you compare it to the million colors a human can distinguish, and the far greater number of unique spectrums that can form those colors.
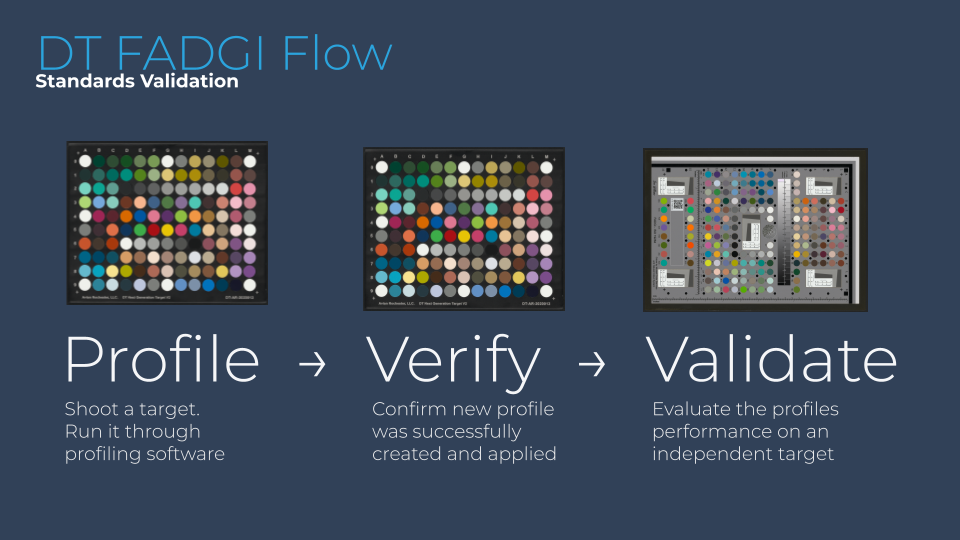
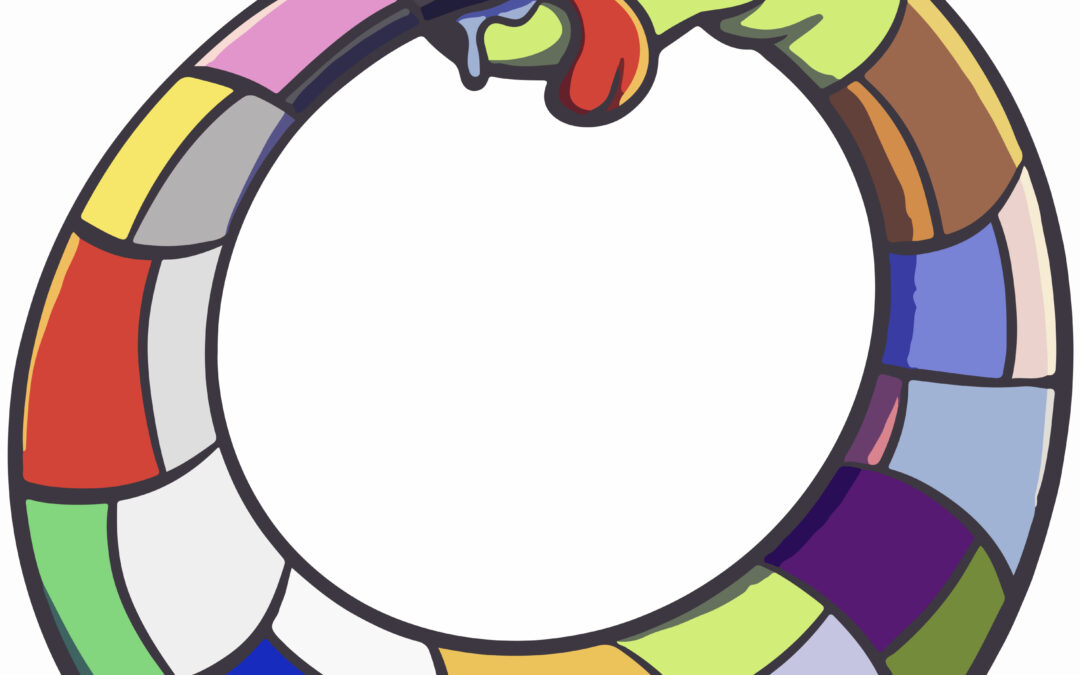
A slide from the recent launch of DT FADGI Flow which provides profiling, verification, and validation (with an independent target) in a single click.
The Three Stages of Color Profiling: Profiling, Verification, Validation
Color Profiling should be a three step process:
- Profile: Calibrate your device with a Profiling Target and Profiling Software.
- Verify: Asses the Profiling Target’s color to check for user or software error. Note that this does not assess the quality of the profile.
- Validate: Asses a Validation Target to determine profile quality using an Independent Target – one with different patches than the Profiling Target.
Step 1 – Profiling
This is done by taking an image of a target such as a DT NGT2, ColorChecker SG, or ISA FADGI 19264 and then running it through profiling software such as DT FADGI Flow, ISA Golden Thread NXT, or basIIColor. The resulting profile should then be loaded into the capture/scan software to be applied to future captures. We have suggested workflows for doing this for both reflective and transmissive materials in our DT Digitization Guide: Reflective Materials and DT Digitization Guide: Transmissive Materials.
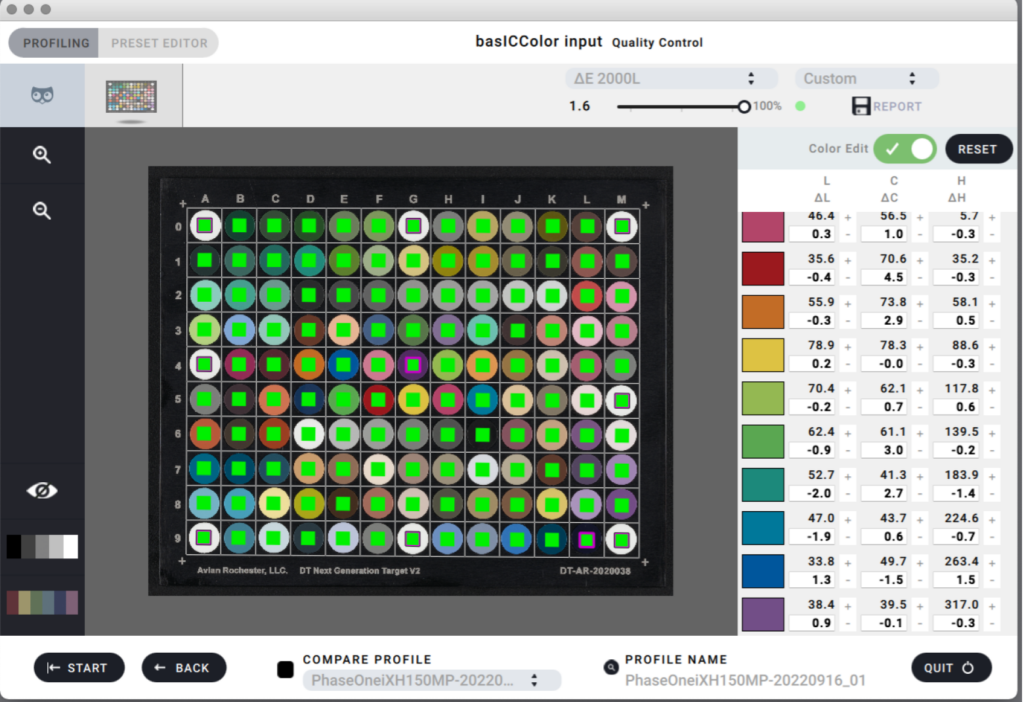
This screen appears in BasICColor after you create a profile. It is an evaluation of the profile on the target with which the profile was created. That’s not informative beyond indicating that the profile was successfully created and applied. A low score here does not mean the profile is good; that must be determined using an independent target.
Step 2 – Verification
Sometimes the user or the software makes a mistake and the profiling process fails. For example the user might have selected a wrong option in the profiling software, or the profiling software might have a bug, or the user might not have correctly set the new profile for capture. So a new capture of the same target should be made with the new profile in place, and that capture should be evaluated in software such as DT FADGIFlow, Golden Thread ISA, or ImageZebra to see if the results indicate the process went as-expected. Note that this does NOT evaluate whether the color profile is objectively good.
Profiles will almost always perform well if you evaluate them using the same make/model of target as was used to create the profile. This is especially true of LUT profiles. LUTs are basically a crib sheet of answers to the test “how does Target X look” so it will always correctly regurgitate the answer when you ask it how Target X looks. For example, if you get dirt on a patch of a target and make a LUT from it, the resulting profile will perform very poorly in real world imaging, but the profiling software can still report exceptionally low DeltaE if that software has been set to be very aggressive at stretching the color profile to hit every patch exactly.
Matrix profiling on the other hand is more holistically robust when done properly. This method is based on first principles and therefore represents a gentler less-patch-specific approach. Therefore Matrix profiling is less likely to produce gross color error in subject matter that is spectrally different than the patches of the target it is trained on.
Testing using the same target as was used to profile the camera verifies that the profile was made and was applied to the image; it does not validate that the profile is well made and is not informative as to the overall color accuracy that profile will provide.
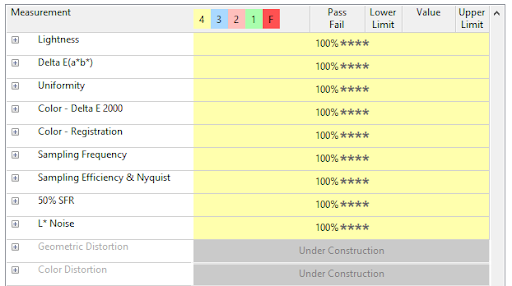
Readouts like these must be read with an understanding of their context. If the file being evaluated is of a target that trained the color profile then you can’t trust that the color profile result is broadly meaningful. Especially with a LUT profile the results on the target you trained will always be numerically good – whether that color accuracy holds for other colors is what matters.
Step 3 – Validation
Finally, the holistic quality of the color profile – that is, how well it matches the color reproduction of its eye, can be evaluated by capturing an entirely different kind of target and evaluating it. So, for example, if the profile was created by capturing a DT NGT then the profile can be validated by evaluating a ISA FADGI 19264 Target.
These results speak to the holistic color accuracy of the digitization system with the color profile applied. These are color patches that the profiling software didn’t see, and wasn’t given the correct answer to in advance.
Using the same profile for training and evaluation is teaching to the test. Validation of a profile must be done on a target other than the one the profile was trained with.
Good color performance on the target used to make the profile only tells you that the software didn’t bug out, and you didn’t click the wrong button. The overall color performance of the system might be good – or it might be mediocre; you can’t know by asking questions you’ve already given the profiling software answers to.
Good color performance on an independent target tells you that the overall color performance of the system is good.